The working benchmark for a well-executed B2B event is a 3x to 5x pipeline multiple, or 300% to 500% ROI, and anything below a 3x floor deserves a hard look at your execution. Before you chase that number, though, fix your measurement rule first: apply the standard ROI formula and lock a 90 to 180 day attribution window before the event even opens registration. Get that sequence backward, and every benchmark comparison you make afterward is noise.
TL;DR:
- A 3x to 5x pipeline multiple is the standard benchmark for a well-executed B2B event, with anything below 3x warranting review of execution.
- Accurate ROI measurement requires setting a 90 to 180-day attribution window and calculating both closed-only and pipeline-adjusted benefits.
- Key KPIs like pipeline value, sales-qualified leads, meeting-to-opportunity rate, and retention are most predictive of actual revenue impact.
- Different event formats require tailored benchmarks, with trade shows focused on return-per-dollar and CPQL, while user conferences emphasize retention metrics.
- Rapid follow-up and integrated workflows reduce lead leakage, which is crucial for improving event ROI and justifying budget decisions.
Table of Contents
- What Are Realistic Event ROI Benchmarks Right Now?
- How Do You Calculate Event ROI?
- Which KPIs Actually Predict Event Revenue?
- How Do ROI Benchmarks Differ by Event Type?
- What Attribution Window Should You Use for Event ROI?
- How Do You Use Benchmarks to Improve Event ROI?
- How Does King Sixteen Approach ROI Measurement on Large Programs?
- What the Benchmarks Really Mean for Your Budget
- How King Sixteen Helps You Protect Your Event ROI
- Sources
- FAQ
What Are Realistic Event ROI Benchmarks Right Now?
A 3x to 5x pipeline multiple is the range most B2B teams should target, according to Sproutworth’s benchmark analysis, with 3x acting as a practical floor rather than an aspirational ceiling. Some organizations report broader working ranges of 200% to 400% ROI depending on how conservatively they count costs, and anything above 5x tends to be the exception, not the rule, usually tied to an unusually strong target-account list or a category-defining launch.
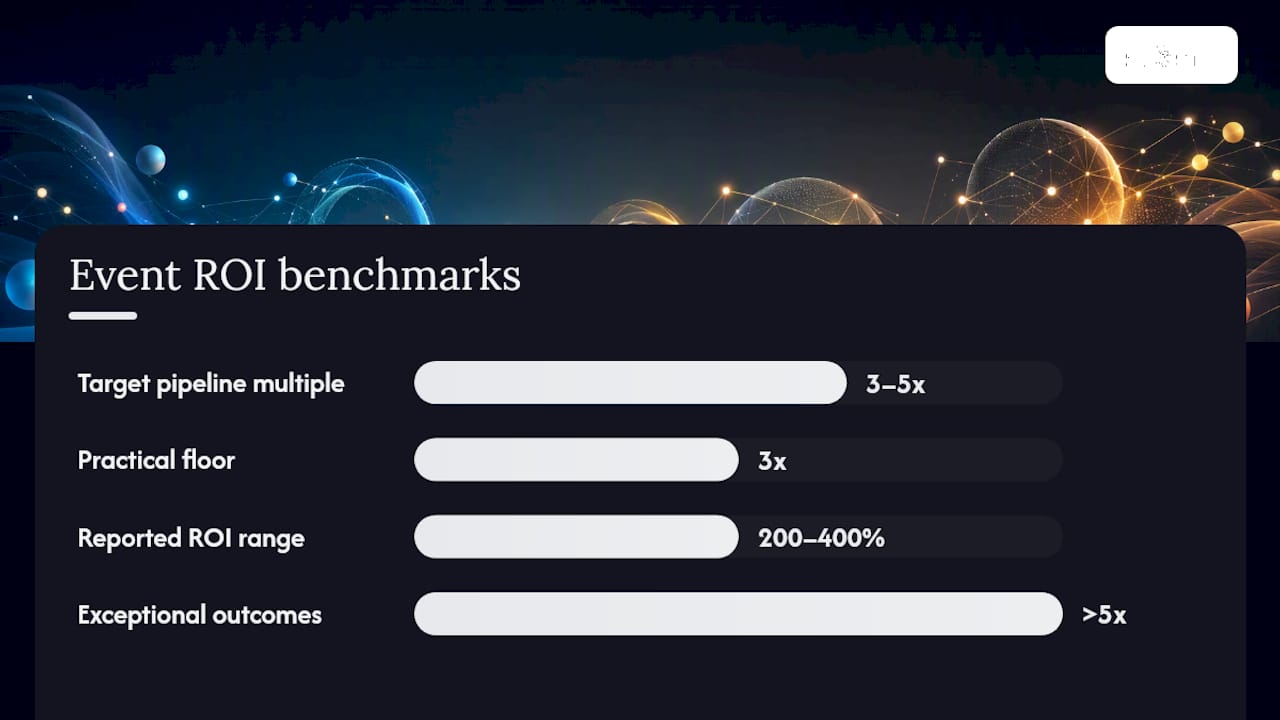
Trade show exhibitors see some of the most dramatic return-per-dollar figures in the industry. CEIR has cited returns as high as $20.98 per dollar spent in certain exhibitor contexts, according to Lensmor’s framework breakdown, though that number reflects a specific measurement lens and shouldn’t be read as a universal exhibitor average.
A few operational targets round out the picture:
- Registration-to-attendance rates vary but are often considered to be moderate for most B2B conferences.
- Meeting utilization, meaning the share of booked meetings that actually happen onsite, is an important operational target often aimed to be reasonably high.
- Net Promoter Score from external attendees above a certain moderate value signals a program worth repeating.
- Cost per qualified lead (CPQL) varies widely by industry and event type, so treat any single CPQL figure as directional, not gospel.
How Do You Calculate Event ROI?
The formula itself is simple: ROI = ((Total Benefits minus Total Costs) divided by Total Costs) x 100. The complexity lives entirely in what you count as a benefit and what you count as a cost, and Lensmor’s guidance recommends running two versions side by side rather than picking one.
- Closed-only ROI counts only revenue that has actually closed within your attribution window. This is the conservative number, and it’s the one most CFOs trust.
- Pipeline-adjusted ROI counts pipeline generated, discounted by your team’s historical close rate, giving credit for deals still in motion without overstating them as closed revenue.
Your cost side needs to be fully loaded, not just the invoices you can point to. That means:
- Venue rental, production, AV, and staging
- Staff time at loaded hourly rates, not just headcount
- Travel, lodging, and per diem for your team
- Technology: registration platforms, lead capture, CRM integration
- Agency or vendor fees
- Post-event follow-up costs, including any sales enablement work
Here’s a simplified worked pair. Say total fully loaded cost is $150,000. That spread between 220% and 370% is exactly why Umbrex recommends presenting both figures rather than one.
Which KPIs Actually Predict Event Revenue?
Engagement numbers feel good in a recap deck, but they’re leading indicators, not the ROI output itself. A packed session or a busy booth means nothing to a CFO unless it converts. Five metrics deserve priority tracking, and each one connects directly to the pipeline math above.
- Pipeline created within 90 to 180 days: the dollar value of opportunities sourced or influenced by the event, tracked against your attribution window.
- Sales-qualified leads (SQLs): leads that pass your ICP filter and get accepted by sales, not just anyone who scanned a badge.
- Cost per qualified lead (CPQL): total event cost divided by SQLs generated, a number that should trend down year over year for a repeatable program.
- Meeting-to-opportunity rate: the share of onsite meetings that convert into a formal opportunity, with 20% or higher considered healthy.
- Net revenue retention among attendee accounts: especially important for user conferences, where the goal is expansion, not acquisition.
Meeting-to-opportunity conversion at 20% or above is the single strongest predictor of whether an event will hit its pipeline multiple target, because it reflects the quality of the audience and the sharpness of the sales follow-up, not just attendance volume. For a deeper breakdown of which KPIs to prioritize by stakeholder, our guide to picking 3 to 7 KPIs by phase walks through the selection process.
How Do ROI Benchmarks Differ by Event Type?
Comparing a trade show booth to a user conference on the same ROI scale is a common mistake, and it produces misleading conclusions. Each format has a different job to do, and the benchmarks should reflect that.
- Trade shows: Exhibitor-focused, with return-per-dollar as the headline metric and CPQL as the operational check. Hosted-buyer programs, where qualified buyers are pre-scheduled into meetings, tend to outperform open-floor booths on both metrics.
- Conferences and field events: These follow the standard 3x to 5x pipeline multiple most closely, since attendance is typically curated toward a target-account list and the sales motion is direct.
- User summits and customer conferences: The win here is expansion and retention, not new logo revenue. Net revenue retention among attendees and renewal rate lift are more honest ROI signals than pipeline generated.
- Virtual and hybrid events: Lower cost almost always means lower engagement, so KPI targets need adjustment. Expect meeting-to-opportunity rates and NPS to run below in-person benchmarks, and judge virtual programs against their own cost base rather than against a live event’s pipeline multiple.
Our attendee engagement guide covers tactics that narrow this gap for hybrid formats specifically.
What Attribution Window Should You Use for Event ROI?
The attribution window you choose can swing your reported ROI by 200% to 400%, according to Lensmor’s analysis, which makes this one of the highest-stakes decisions in your entire measurement plan. Set it before the event, not after you see the numbers.
- Use a 90-day minimum window for most B2B events, extending to 180 days for enterprise sales cycles where deal velocity is naturally slower.
- Choose your attribution model deliberately. W-shaped multi-touch models credit multiple touchpoints across the funnel and work well for complex buying committees. Sourced versus influenced reporting is simpler and better suited to smaller teams that don’t have a mature multi-touch setup.
- Configure your CRM before the event, not during follow-up week. Meeting logs should serve as your ground truth for attribution, since pre-booked meetings are among the most reliable signals of real buyer intent.
- Integrate your tech stack rather than reconstructing data after the fact. Teams with tightly integrated event technology report significantly higher confidence in their ROI numbers, because nothing gets lost between registration, onsite capture, and the CRM.
Pro Tip: Present both a closed-only and a pipeline-adjusted ROI figure in every board report. CFOs tend to trust the conservative number; CMOs need the pipeline-adjusted one to justify next year’s budget.
How Do You Use Benchmarks to Improve Event ROI?
Benchmarks are only useful if they change what you do before, during, and after the event. Here’s the sequence that actually moves the number.
- Set one primary KPI per stakeholder group before the budget gets approved, so sales, marketing, and finance aren’t arguing about success after the fact.
- Fix your attribution model and window before registration opens, not during post-event reporting.
- Run target-account outreach and personalized meeting invites pre-show using the LinkedIn Ad Generator to lift meeting acceptance rates.
- Log every meeting onsite and track the kept-rate against booked meetings, filtering leads through your ICP before they ever hit the CRM.
- Follow up fast. Leads contacted within an hour qualify roughly seven times more often than leads contacted later, yet the average team takes 42 hours to respond.
A few habits separate teams that hit their benchmark from teams that miss it:
- Report in phases at 30, 90, and 180 days, so leadership sees early momentum and final results without waiting for a single end-of-quarter number.
- Close the loop after every event with a short debrief on what worked, feeding directly into next event’s target-setting.
- Treat onsite engagement tactics as a lever for meeting quality, not just attendance volume. Our attendee engagement playbook covers specific tactics that raise kept-rate and lead quality simultaneously.
How Does King Sixteen Approach ROI Measurement on Large Programs?
Fully loaded costing matters most on large experiential builds, where a custom fabrication piece can distort a single event’s number if you don’t amortize it correctly. Spreading fabrication and installation costs across multiple activations, or across a multi-year sponsorship term, produces a far more accurate cost-per-event than treating a one-off build as a single-event expense.
Lead leakage tends to happen at the seams between registration, onsite capture, and CRM handoff. Reducing those seams is largely a workflow problem:
- Pre-booked meetings get logged as the attribution ground truth, not reconstructed from memory after the show.
- Onsite lead capture feeds directly into the CRM rather than sitting in a spreadsheet until the following week.
- Follow-up sequences launch within hours, not days, on qualified contacts.
What the Benchmarks Really Mean for Your Budget
Benchmarks exist to help you defend cutting a program as much as they help you defend keeping one.
If I had to pick the single highest-leverage investment across everything covered here, it wouldn’t be venue or production spend. It would be integration and follow-up speed. A team that logs meetings accurately and responds within an hour will consistently outperform a team with a flashier activation and a 42-hour follow-up gap.
— Tyler
How King Sixteen Helps You Protect Your Event ROI
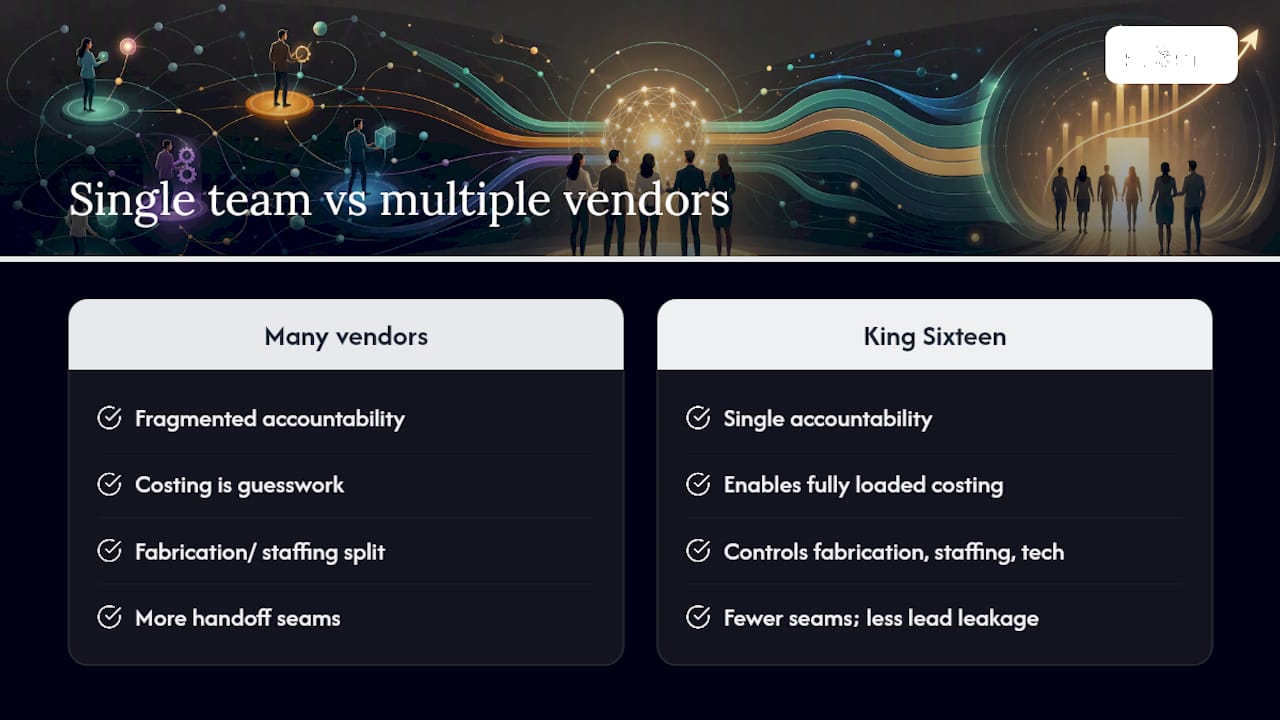
King Sixteen is the alternative to juggling five vendors and hoping your attribution survives the handoffs. When a single team handles design, fabrication, staffing, AV, and logistics under one contract, it reduces gaps between production and measurement where leads and cost data might otherwise disappear.
A single-accountability structure helps make fully loaded costing possible. When one partner controls the fabrication schedule, the staffing plan, and the onsite tech stack, amortizing a custom build across multiple activations stops being guesswork and becomes a real line item you can defend to finance. It also closes the lead leakage gap this article covers: meeting logs, badge scans, and CRM handoff run through fewer seams, which means faster follow-up and a cleaner attribution story at the 90-day mark.
Whether you’re planning a full experiential activation or a private brand event with hard revenue targets attached, a scoping conversation with King Sixteen starts with your measurement plan, not just your creative brief. Visit Kingsixteen to talk through what a turnkey program would mean for your next event’s pipeline multiple.
Sources
The 3x to 5x pipeline multiple and 90 to 180 day attribution guidance come from Sproutworth’s 2026 benchmark report and Converve’s B2B measurement guide. Lead response time data and follow-up benchmarks are drawn from Samaaro’s B2B event marketing report, while the guidance on presenting benchmarks by source owner comes from Umbrex’s post-event ROI analysis. Exhibitor return-per-dollar figures and CPQL context are sourced from Lensmor’s ROI framework.
- How to Measure Event ROI: Formula, KPIs, 2026 Benchmarks
- How to Measure B2B Event ROI
- Post-event ROI Analysis - Measure Event Success
FAQ
What Are KPIs for Events?
Our KPI selection guide breaks down how to pick the right set by stakeholder.
What Attribution Window Should I Use to Measure Event ROI?
Use a minimum 90-day window for most B2B events, and extend to 180 days for enterprise sales cycles with longer buying processes, reporting in phases at 30, 90, and 180 days.
Does King Sixteen Help With Event ROI Measurement?
A turnkey production model that integrates fabrication, staffing, and onsite logistics under one contract can reduce data gaps between registration, lead capture, and CRM handoff that often distort ROI reporting. Current service details and pricing are available directly on the King Sixteen site.
Recommended
- Event Teams: Pick 3 to 7 KPIs That Prove ROI by Phase
- Trade Show Lead Capture: Software vs. Agency Guide
- Innovative event marketing strategies to maximize brand impact
- Why Events Drive Revenue: A Guide for Marketers