Every event should be measured against three phases: pre-event conversion, in-event engagement, and post-event revenue impact. Prioritize registration conversion rate, attendance rate, cost per attendee, engagement signals like dwell time, and ROI, all mapped to one business objective. Pick 3 to 7 KPIs before you launch, set targets and owners for each, and build a one-page dashboard so nobody is arguing about “success” after the fact.
TL;DR:
- The most critical KPIs for event success are tied to specific business objectives and should be limited to 3 to 7 measures to maintain focus.
- During the event, real-time monitoring of check-in rates, session attendance, dwell time, and sentiment provides immediate insights for operational adjustments.
- Post-event evaluation should emphasize actual results against targets, pipeline impact, and revenue attribution, with concise scorecards delivered within 10 business days.
- Data hygiene practices, such as consistent UTM parameters and accurate CRM integration, are essential to prevent inflated metrics and ensure reliable measurement.
- A KPI framework must be established before booking vendors or venues, aligning measurement tools and targets with strategic objectives to avoid ineffective and cluttered reporting.
Table of Contents
- What Are Event KPIs, and How Do They Differ From Metrics?
- Core KPIs to Track, Organized by Phase
- How to Choose the Right KPIs for Your Event
- How to Measure and Calculate Key Event KPIs
- Real-Time Monitoring and Dashboards During the Event
- Post-Event Reporting: Scorecards, Cadence, and Proving ROI
- Common Mistakes and Practical Pro Tips
- Tools and Technology Categories for KPI Tracking
- King Sixteen’s Approach: KPIs for High-Impact Experiential Work
- The Playbook Most Event Teams Get Backwards
- Let King Sixteen Build Your KPI Strategy From the Brief Forward
- Sources
What Are Event KPIs, and How Do They Differ From Metrics?
An event metric is any number you can count. Registrations, badge scans, social mentions, coffee cups used. An event KPI, or key performance indicator, is a metric you have deliberately chosen because it’s tied to a business objective and a target. That distinction sounds academic until budget season, when someone asks why a $200,000 activation matters, and “we had great engagement” isn’t an answer anyone in finance accepts.
Marketing budgets have flattened at roughly 7.7% of company revenue, which means event teams face more pressure than ever to justify spend with numbers that connect to pipeline and revenue, not just attendance. That single fact reshapes how you should think about event success indicators: a KPI earns its place on your dashboard only if a leadership team member would care about it in a budget meeting.
The practitioner-forward way to organize event performance metrics is by phase, since each phase answers a different business question. Pre-event KPIs tell you whether your marketing is working. During-event KPIs tell you whether your content and experience are landing. Post-event KPIs tell you whether the whole thing paid for itself.
Core KPIs to Track, Organized by Phase
Pre-event: are people showing up, and why
Before doors open, your job is demand generation and forecasting. These KPIs tell you whether your promotion is converting or quietly failing.
- Registration starts and completions. Track both, since a big gap between the two signals a broken or overly long registration form.
- Registration conversion rate. The percentage of people who land on your registration page and actually register. This is your clearest read on messaging and offer strength.
- Registration pace (velocity). Week-over-week registration counts, plotted against your event date. Practitioners generally see an early-bird spike, a plateau in the middle weeks, and a final surge in the last two weeks before the event, so a flat middle period isn’t automatically a crisis. A missing final surge, however, usually means you need to shift spend or sharpen your last-call messaging.
- Channel attribution. Which channel, email, paid social, partner promotion, sales outreach, is actually driving registrations, not just clicks.
- Cost per lead / cost per registrant. Marketing spend divided by registrants, broken out by channel so you know where to double down.
During-event: is the room actually engaged
Once the event starts, you’re measuring whether the experience you built is working in real time.
- Check-in rate. Registered attendees who actually showed up, tracked hour by hour on event day.
- Session attendance and drop-off. How full each session runs and where people leave early, which flags weak content or scheduling conflicts.
- Dwell time. How long attendees stay in a space, booth, or session. For brand activation metrics specifically, dwell time is often the single best proxy for genuine interest, since people don’t linger somewhere boring.
- App adoption and usage. Downloads, logins, and in-app actions like agenda building or messaging.
- Live NPS or CSAT pulse. A quick in-event survey, often a single question, that catches problems while you can still fix them.
- Badge scans at booths or sessions. Useful for exhibitor and sponsor reporting, and for identifying your most-visited zones.
- Meetings booked. For conferences and trade shows, on-site meetings scheduled through the app or by staff are a strong signal of commercial intent.
Post-event: did it pay off
This is where vanity metrics get exposed and where finance starts paying attention.
- Final attendance rate. Actual attendees divided by total registrants, the definitive version of the check-in number.
- Net Promoter Score (NPS). Post-event survey scoring, segmented by attendee type where possible.
- Qualified leads and sales-qualified leads (SQLs). Not just leads collected, leads that sales actually accepts.
- Pipeline influenced or sourced. Opportunity value tied back to the event, using an agreed attribution window.
- Customers acquired. The hard number, deals closed that trace back to the event.
- Revenue per attendee. Total attributable revenue divided by total attendees, a clean efficiency benchmark you can compare across events.
- Cost per attendee. Fully loaded event cost divided by attendees, the companion figure to revenue per attendee.
- Return on investment (ROI). The number the CFO actually reads.
- Sponsor-specific KPIs. Renewal rate, leads delivered per sponsor tier, and booth traffic, all reported back to sponsors directly.
Not every number on this list deserves a place on your dashboard. Total social impressions, app downloads with no follow-on activity, and raw attendee counts with no revenue tie are classic vanity metrics: they look good in a recap deck and mean almost nothing to a P&L. Bizzabo’s research on senior-level event KPI frameworks recommends tracking 8 to 12 KPIs across an entire event portfolio while limiting any single event’s active dashboard to a focused handful. The difference between a vanity metric and a real signal usually comes down to one question: does this number change what leadership decides to do next?
How to Choose the Right KPIs for Your Event
Most teams get event analytics backwards. They start by listing everything they can measure, then try to justify each line item after the fact. Do the opposite: start with the business objective, and let the objective narrow your list.
- Name one primary objective. Demand generation, pipeline creation, brand awareness, customer retention, or product launch momentum. Pick one. If leadership hands you three, ask them to rank them.
- Choose 1 to 2 primary KPIs tied directly to that objective. A product launch’s primary KPI might be qualified demos booked. A brand activation’s might be dwell time plus social reach.
- Add 3 to 5 supporting KPIs that explain the “why” behind your primary number, capping the total set at 7. Walls.io’s guidance on phase-based event tracking backs this same range, since more than seven KPIs tends to dilute focus rather than sharpen it.
- Apply four selection filters to every candidate KPI: Is it aligned to the objective? Can you actually measure it with your current tools? Is it actionable, meaning a bad number would change a decision? And is the data genuinely available, not something you’re hoping to backfill later?
- Set three targets per KPI, a conservative floor, an expected outcome, and a stretch goal, using last year’s event or an industry benchmark as your baseline.
- Document the definition and data source for every KPI before the event, not after. “Attendance rate” means nothing until you’ve written down whether it counts no-shows, walk-ins, and virtual-only viewers the same way.
- Assign a named owner and reporting cadence to each KPI. Marketing owns registration pace. Ops owns check-in rate. Sales owns pipeline. Someone checks each number on a defined schedule, or it doesn’t get checked.
Pro Tip: Write your KPI definitions into a shared tracking plan document before you launch registration, not during post-event reporting. Disagreements over what “attendance” or “qualified lead” means are the single most common cause of a messy recap meeting.
How to Measure and Calculate Key Event KPIs
Formulas make event success measurable instead of subjective, and none of these require complicated software, just consistent inputs.
- Registration conversion rate = (Registrations ÷ Registration page visitors) × 100
- Attendance rate = (Actual attendees ÷ Total registrants) × 100
- Cost per attendee = Total fully loaded event cost ÷ Actual attendees
- Revenue per attendee = Total attributable revenue ÷ Actual attendees
- Event ROI = ((Revenue attributed to event − Total event cost) ÷ Total event cost) × 100
A quick illustration: say a conference costs $180,000 fully loaded and draws 400 attendees. Cost per attendee comes out to $450. That number only holds up if your finance team agrees on the attribution window in advance.
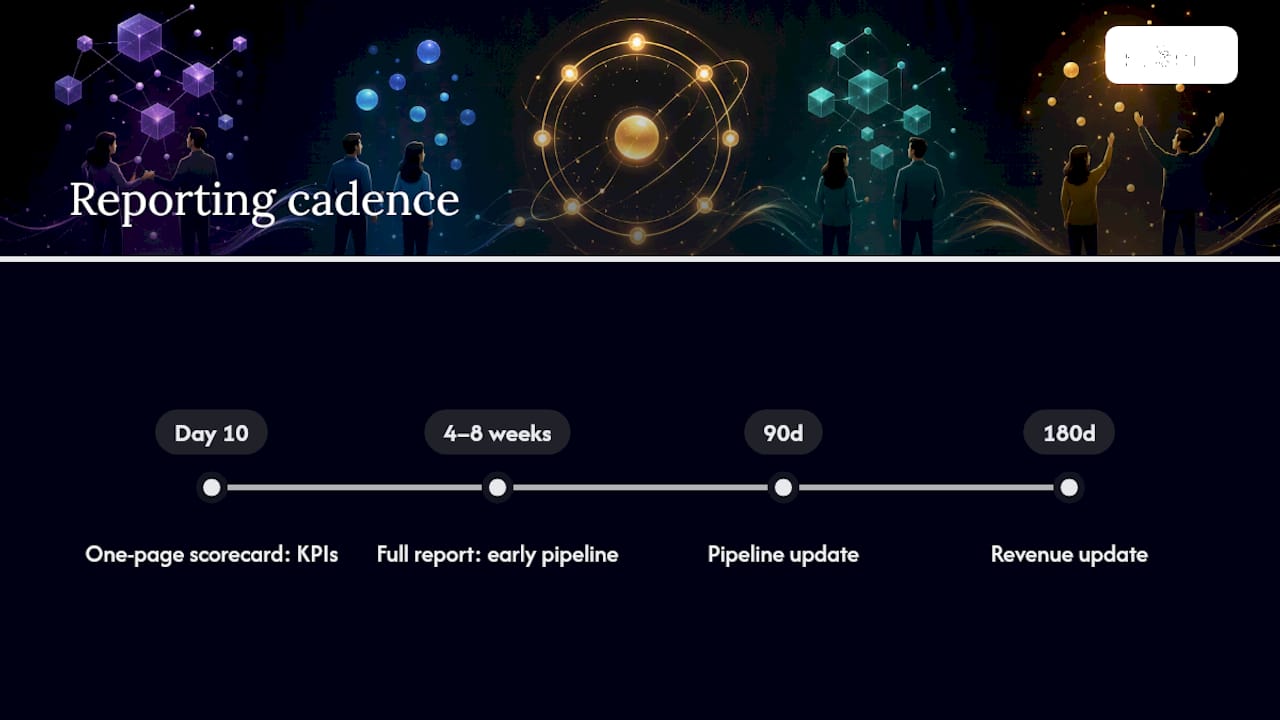
Attribution windows matter more than most teams realize. Event-sourced pipeline (a lead that entered your CRM because of the event) is a cleaner claim than event-influenced pipeline (an existing deal that the event helped move forward). Cvent’s event ROI methodology recommends pairing quantitative revenue figures with qualitative satisfaction data like NPS, since a high-ROI event with a terrible attendee experience rarely repeats its numbers the following year. Most B2B teams track immediate pipeline at 30 days, then check again at 90 and 180 days, since enterprise sales cycles routinely outlast the event recap deck.
On data hygiene: pull registration data from your event platform with UTM parameters attached to every promotional link, reconcile badge scan exports against your CRM contact records, and dedupe leads by email domain before you calculate cost per lead. Skipping the dedupe step is the fastest way to accidentally inflate your lead count and deflate your real cost per acquisition.
Real-Time Monitoring and Dashboards During the Event
High-performing event teams don’t wait for the post-event report to make decisions. They watch a live dashboard and act on it while the event is still running, which is a fundamentally different discipline than reporting after the fact.
The KPIs worth watching in real time are narrower than your full post-event list:
- Check-in throughput by hour, to spot bottlenecks before a line forms out the door.
- Session fill rate, so you can redirect foot traffic to underattended rooms.
- Live dwell time by zone, flagging which activations are pulling crowds and which are dead space.
- A live NPS or sentiment pulse, caught through a quick in-app survey or staff check-ins.
- App messages and support requests, an early warning system for logistics problems.
Design your dashboard around roles, not one giant screen everyone squints at. Give the operations lead a single “war room” summary with the five numbers above. Give floor staff a mobile snapshot limited to check-in pace and session capacity for their specific zone. Give the executive sponsor watching from the client suite a simplified three-number view: registrations checked in, top session fill rate, and live sentiment score.
Set clear operational triggers ahead of time. If check-in throughput drops below your target pace for 15 minutes, open a second kiosk. If live sentiment dips below your floor target, get a producer into that space immediately.
Pro Tip: Run an end-to-end instrumentation test 48 hours before doors open, badge scanners, app telemetry, UTMs, and survey triggers, all firing together. A broken sync between your badge system and CRM is far easier to catch in a rehearsal than to explain in a post-event scorecard.
If you’re running QR-based check-in, review the check-in playbook for the operational details that keep guest flow moving without a bottleneck at the door.
Post-Event Reporting: Scorecards, Cadence, and Proving ROI
The report you send matters almost as much as the numbers inside it. A 40-slide recap deck gets skimmed once and forgotten. A one-page scorecard gets referenced in the next budget conversation.
Build your scorecard around four elements: actual results against target for each of your 3 to 7 KPIs, the top three findings from the event, a trend comparison against your prior event, and two or three recommended actions for next time. Keep it to a single page. If it doesn’t fit, you’re including too much detail and not enough judgment.
Timing shifts the tone of the conversation. Publishing a one-page KPI scorecard within 10 business days after the event keeps the discussion focused on decisions rather than fading memories. Follow with a fuller report in 4 to 8 weeks once early pipeline data settles, then update pipeline and revenue figures again at the 90 and 180 day marks as deals move through the funnel. For a full walkthrough of building that recurring reporting rhythm, see this post-event reporting guide.
Calculate cost per attendee and ROI using fully loaded costs, meaning direct spend plus allocated overhead like staff time, internal design hours, and a share of your team’s software subscriptions. Skipping overhead is the single most common way event ROI gets overstated, and it’s usually the first thing a sharp CFO catches.
Sponsors deserve their own reporting track. Recommended sponsor KPIs include booth traffic, leads delivered per sponsor tier, and scan-to-meeting conversion, reported in a dedicated sponsor debrief within two to three weeks of the event, well ahead of your renewal conversation.
Common Mistakes and Practical Pro Tips
The most common measurement failure isn’t a bad KPI. It’s too many KPIs, tracked inconsistently, with costs that never fully add up. Watch for these specifically:
- Tracking 15 metrics instead of 7 KPIs, which buries the numbers that actually matter.
- Leaning on vanity metrics like impressions or app downloads with no tie to revenue or pipeline.
- Undercounting costs by leaving out staff time, internal hours, or software overhead.
- Inconsistent definitions across teams, where marketing and sales count “qualified lead” differently.
Pro Tip: Standardize UTM parameters across every promotional channel before registration opens, and monitor registration velocity weekly rather than waiting for a final count. Segmenting NPS by attendee persona, prospect versus existing customer versus partner, also reveals problems a blended average hides completely.
Get sales and finance to agree on lead qualification rules and attribution windows before the event, not during the post-mortem. That single conversation prevents most of the arguments that otherwise derail reporting.
Tools and Technology Categories for KPI Tracking
You don’t need a single monolithic platform, but you do need five capabilities working together: a registration system that captures UTM parameters natively, an engagement platform for session and app data, badge or QR scan technology, CRM or marketing automation integration, and a BI or dashboarding layer to pull it all into one view.
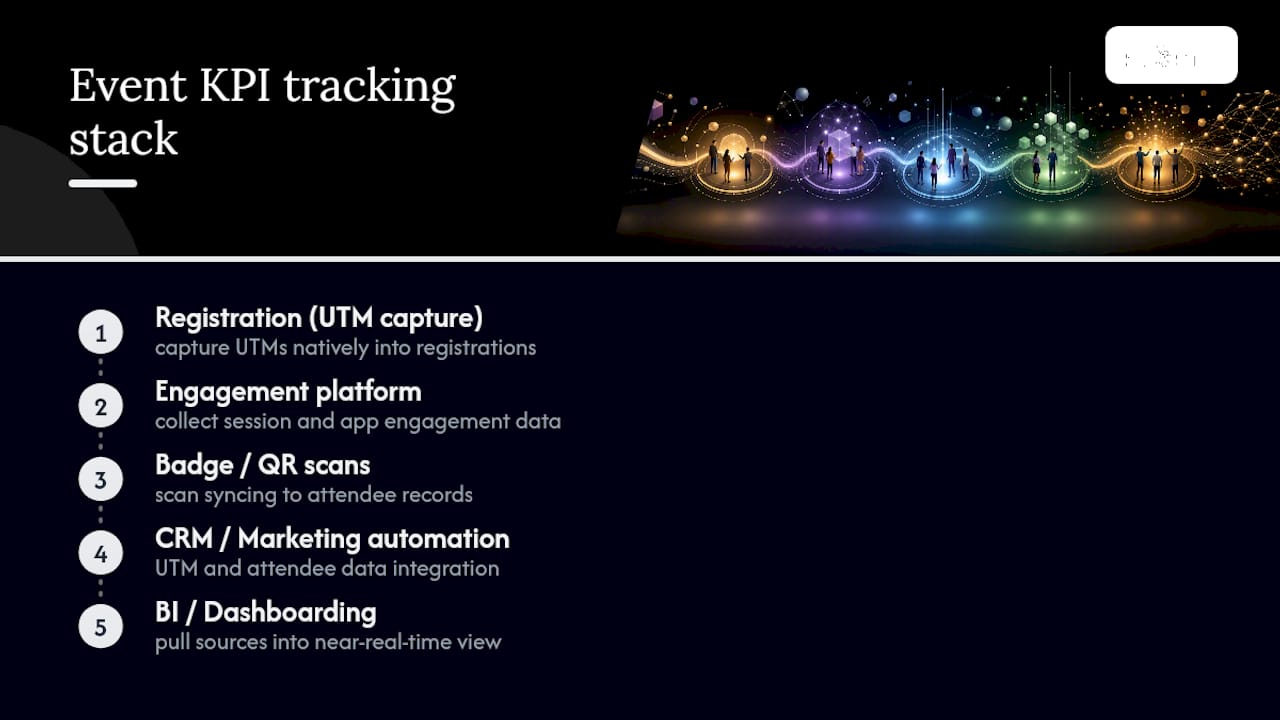
Before the event, run an integration checklist: confirm UTMs pass cleanly into your CRM, test that badge scans sync to attendee records without duplication, and verify your dashboard refreshes in near real time rather than on a delayed batch job.
Spreadsheets are fine for a single-day, sub-200-person event with one registration channel. Once you’re running multi-session tracks, sponsor tiers, or a hybrid audience, you need platform-level integrations, since manual reconciliation across sources becomes a full-time job and a reliable source of errors. For a broader look at how event data feeds marketing decisions beyond the event itself, that connection between instrumentation and strategy is worth studying before you lock in your stack. Teams weighing similar tradeoffs in adjacent channels can find useful parallels in how digital teams approach website KPI tracking, where the same alignment-first logic applies.
King Sixteen’s Approach: KPIs for High-Impact Experiential Work
King Sixteen builds KPI selection into the activation brief itself, before fabrication or staffing decisions get made. A product launch gets measured against demos booked and pipeline generated. A brand activation gets measured against dwell time, social reach, and press mentions. The KPI set changes with the objective, never the other way around.
Our one-page scorecards follow the 10 business day rule: actual versus target, top findings, and next-event recommendations, delivered before the client’s next budget cycle starts. That timing has repeatedly turned a single activation into a repeat retainer, because clients get a clear answer instead of a vague recap.
The Playbook Most Event Teams Get Backwards
Here’s an opinion worth sitting with: most event teams don’t fail at measurement because they lack tools. They fail because they measure everything and decide nothing. A dashboard with 20 metrics feels thorough in a planning meeting and useless in a budget review, because nobody can point to the three numbers that actually moved the business.
The conventional advice, “track more, report more,” has it backwards. The teams getting real value from event analytics are the ones ruthless enough to cut a KPI that feels important but isn’t tied to the primary objective. Dwell time matters enormously for a brand activation and barely at all for a lead-gen field event. Treating every event with the same KPI template is how vanity metrics survive year after year.
If you take one thing from this playbook, make it this: agree on your 3 to 7 KPIs and their targets before you book a venue, not after the event wraps. Everything else, the dashboards, the formulas, the scorecard, is just infrastructure built to support that one early decision.
— Tyler
Let King Sixteen Build Your KPI Strategy From the Brief Forward
Most event teams bolt measurement onto a plan that’s already locked, then scramble to explain results after the fact. King Sixteen builds the KPI framework into the activation brief itself, before a single vendor is booked, so instrumentation, dashboards, and reporting are working from day one instead of patched together after the fact.
That means your registration UTMs, badge scan systems, CRM integration, and post-event scorecard are planned alongside the stage design and guest experience, not treated as an afterthought once the invoices come in. Whether you’re running a product launch that needs pipeline attribution or a brand activation built around dwell time and social reach, our experiential marketing team designs the measurement plan around your specific objective, not a generic template.
If you’re planning your next activation, request a KPI-aligned project brief and we’ll map your objectives to a concrete measurement plan before you commit to a venue or vendor.
Sources
- Gartner 2025 CMO Spend Survey press release
- Event KPIs — the metrics every event professional should track — Walls.io