A post-event report is the single document that proves event performance and turns raw data into prioritized decisions. The fastest way to produce one: use a consistent event report template, capture your KPIs during the event itself, and deliver a one-page BLUF to stakeholders within 48 hours, followed by the full report within a week after the event.
Post-event reporting sits at the intersection of accountability and strategy. Done well, it answers the questions every sponsor, CMO, and operations lead is already asking before the last attendee walks out the door. Done poorly, it leaves your team debating what actually happened while the data goes stale.
Your one-page executive summary should include, at minimum:
- Total registrations vs. actual attendance (and no-show rate)
- Revenue, total cost, and net ROI
- Top three marketing channels by lead volume or conversion
- Attendee NPS or satisfaction score
- One headline win and one priority fix
Two-line BLUF you can paste directly into a stakeholder email:
“[Event Name] drew [X] attendees against a goal of [Y], generating [Z] qualified leads at a cost per lead of [$X]. Attendee satisfaction scored [X/10], and the top recommended action for [next event] is [one-sentence recommendation].”
That structure, adapted from the Whova post-event report guide, keeps leadership informed without burying them in appendix data they’ll never read.
Key Takeaways
A post-event report that combines a 48-hour BLUF with a full report delivered within 7 days, built on a consistent template, gives your team the data to prove ROI, negotiate better contracts, and plan smarter.
| Point | Details |
|---|---|
| Deliver the BLUF in 48 hours | Send a one-page summary to all stakeholders within 48 hours to preserve momentum and signal discipline. |
| Use a consistent template | A reusable event report template enables year-over-year benchmarking and cuts formatting time so your team focuses on analysis. |
| Calculate ROI with a clear formula | ROI (%) = [(Revenue − Cost) ÷ Cost] × 100; report a confidence range alongside the figure for credibility. |
| File your PER with venues | The APEX Post-Event Report recommends attaching your PER to future RFPs, turning historical data into negotiation leverage. |
| King Sixteen builds reporting in | King Sixteen’s turnkey production model integrates data capture and post-event reporting from the start, not as an afterthought. |
Table of Contents
- What should a post-event report include?
- How do you measure event success and calculate ROI?
- Where do you source the data, and when should you capture it?
- A ready-to-use post-event report template and sample
- How do you present the report to different stakeholders?
- How do you turn event findings into a prioritized action plan?
- What King Sixteen measures for experiential activations
- Who should own the report, and when should it be delivered?
- King Sixteen handles the reporting so you can focus on what’s next
- Sources
What should a post-event report include?
The industry term for this document is a Post-Event Report, or PER. Think of it as two layers: the report itself (the facts) and the post-event analysis (what those facts mean). The best deliverables combine both, with a concise stakeholder-facing summary up front and full documentation in the appendix.
Here is the canonical section-by-section structure, with field-level guidance for each:
1. Executive Summary One page. State the event name, date, location, total attendance, revenue, ROI, and the top three findings. This is the only section most executives will read, so make every line count. Audience: C-suite, board, sponsors.
2. Objectives and KPIs List the goals you set before the event and score each one. Did you hit your registration target? Your lead goal? Your revenue threshold? Pair each objective with the actual result and a simple pass/fail or percentage-to-goal. Audience: marketing leadership, event director.
3. Attendance and Registration
- Total registrations by type (paid, comp, speaker, sponsor, press)
- Actual attendance and no-show rate
- Attrition vs. contracted room block (critical for hotel negotiations)
- Session-level attendance for multi-track events
- Walk-in vs. pre-registered split
4. Marketing Performance
- Channel breakdown: email, paid social, organic, partner, direct
- Click-through rates and conversion rates by channel
- Cost per lead (CPL) and cost per registration
- Influencer or media reach if applicable
5. Financial Summary
- Revenue by line item: ticket sales, sponsorships, exhibitor fees, ancillary
- Expenses by category: venue, AV, catering, staffing, marketing, production
- Budget vs. actuals variance for each line
- Net profit or loss
6. ROI State the formula and the result. Include attribution methodology so stakeholders understand what is and is not counted.
7. Sponsor and Exhibitor Outcomes
- Leads captured per sponsor/exhibitor
- Impressions and brand visibility delivered
- Fulfillment checklist against contracted deliverables
- Sponsor satisfaction score (if surveyed)
8. Attendee Feedback and Satisfaction
- NPS score and response rate
- Top-rated sessions or activations
- Most-cited complaints or friction points
- Selected verbatim comments (positive and constructive)
9. Logistics and Operations What broke, what worked, and what surprised you. AV uptime, catering timing, registration flow, staffing gaps. This section is the operational team’s primary reference for the next event.
10. Lessons Learned and Recommendations Prioritized list of changes, tied to specific data points. Not “improve registration” but “add a second check-in lane; the 8:00–8:30 AM window had a 12-minute average wait.”
11. Appendix Full survey data, budget variance tables, session attendance logs, vendor contact list, and timeline or Gantt reference for future planning.
Pro Tip: Map each section to its primary audience before you write it. Sponsors want leads and impressions. Finance wants variance. Operations wants the logistics notes. Tailoring the depth of each section to its reader saves you from writing a 40-page document nobody finishes.
How do you measure event success and calculate ROI?
Measurement starts before the event, not after. The KPIs you track and the formulas you apply determine whether your event data tells a clear story or a confusing one.
Core KPIs to track
- Attendance rate: Actual attendees ÷ total registrations × 100
- Cost per lead (CPL): Total event cost ÷ total qualified leads generated
- Cost per acquisition (CPA): Total event cost ÷ closed deals attributed to the event
- Net Promoter Score (NPS): % Promoters minus % Detractors
- Session engagement rate: Average session attendance ÷ total attendees × 100
- Sponsor lead volume: Leads scanned or captured per sponsor booth or activation
- Revenue per attendee: Total revenue ÷ actual attendance
The ROI formula
ROI (%) = [(Revenue Attributed to Event − Total Event Cost) ÷ Total Event Cost] × 100
Worked example: Your product launch costs $120,000 to produce. During and within 90 days after the event, your CRM attributes $340,000 in closed revenue to attendees who were at the event.
That number only holds if your attribution model is honest. Most events touch prospects at multiple points, so a pure last-touch model overstates event impact while a pure first-touch model often understates it. Multi-touch attribution, where credit is distributed across all touchpoints in the buyer journey, gives the most defensible number for a Cvent-style ROI report.
Pro Tip: Report a confidence range alongside your ROI figure, not just a single number. “We attribute $280,000–$340,000 in revenue to this event, depending on attribution model” is more credible to a CFO than a precise figure that assumes perfect attribution. Ranges signal analytical rigor, not uncertainty.
Where do you source the data, and when should you capture it?
Data quality is the biggest variable in post-event reporting. The metrics you fail to capture during the event are rarely recoverable afterward. Starting feedback and operational data collection during the event itself is the single most effective way to avoid a report full of gaps.
Primary data sources:
- Registration platform (Cvent, Eventbrite, or your CRM): registrations, ticket types, demographics
- On-site badge scanners or check-in apps: actual attendance, session attendance
- Payment processor or accounting system: revenue, refunds, net receipts
- Survey tools (SurveyMonkey, Typeform, or in-app survey features in Whova): NPS, satisfaction, verbatims
- CRM (Salesforce, HubSpot): lead quality, pipeline created, deals closed
- Web analytics (Google Analytics 4): event-driven traffic, landing page conversions
- Social listening tools: reach, impressions, share of voice
Collection timeline:
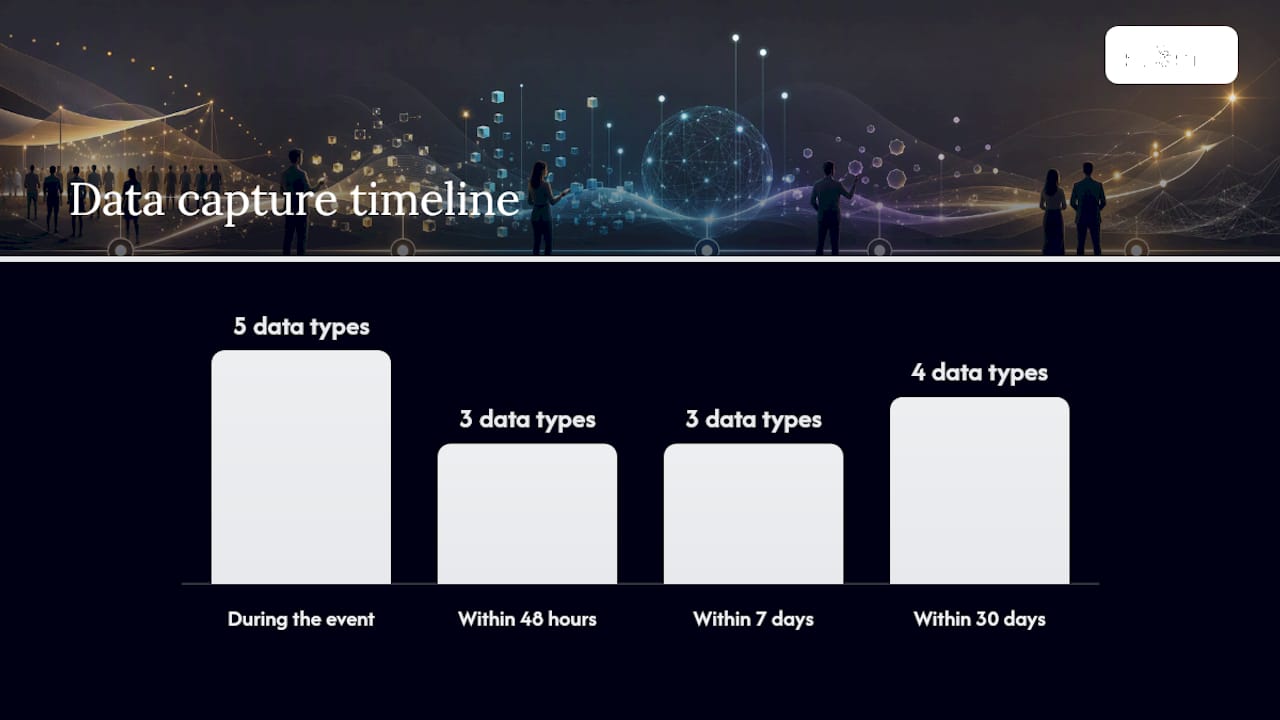
| Timing | What to capture |
|---|---|
| During the event | Badge scans, session attendance, real-time lead captures, staff incident logs, AV uptime notes |
| Within 48 hours | Raw registration vs. attendance reconciliation, sponsor lead counts, initial staff debrief notes |
| Within 7 days | Survey responses (send within 24 hours while the event is fresh), marketing channel performance, financial actuals |
| Within 30 days | CRM pipeline attribution, closed-deal tracking, final budget reconciliation, vendor invoices |
For effective survey design that maximizes response rates, keep post-event surveys to five questions or fewer, send within 24 hours, and include one open-ended question for verbatim feedback. Response rates drop sharply after 48 hours.
Pro tip on data quality: Deduplicate leads before reporting. A single attendee who visited three sponsor booths and scanned their badge each time is one lead, not three. Set deduplication rules in your CRM before the event, not after.
A ready-to-use post-event report template and sample
The APEX Post-Event Report from the Convention Industry Council is the recognized industry standard. It recommends completing the PER within 60 days, filing a copy with your venue, and attaching the most recent PER to future RFPs. That last point matters more than most planners realize: a completed PER is a negotiation tool, not just a record.
One-page executive summary template
EVENT NAME:
DATE(S) / LOCATION:
EVENT TYPE:
PRODUCED BY:

HEADLINE RESULTS
- Total Registrations: [X] | Actual Attendance: [X] | No-Show Rate: [X%]
- Total Revenue: $[X] | Total Cost: $[X] | Net ROI: [X%]
- Qualified Leads Generated: [X] | Cost Per Lead: $[X]
- Attendee NPS: [X] | Survey Response Rate: [X%]

TOP THREE FINDINGS
1. [Finding + supporting data point]
2. [Finding + supporting data point]
3. [Finding + supporting data point]

PRIORITY RECOMMENDATION
[One sentence: what to do differently next time and why]
Short sample report (conference format)
Three of four sponsors confirmed renewal interest during the event.
Financial summary: Total revenue came in at $218,000 against a budget of $200,000, driven by two late-added sponsorship packages.
The most-cited friction point was registration line wait times during the 8:00–8:30 AM window.
Appendix tables
Budget vs. actual variance:
Pro Tip: Use the same template for every event you produce. A consistent event report template lets you compare year-over-year performance without reformatting data, and it builds the historical archive you’ll need when negotiating room blocks and AV contracts.
How do you present the report to different stakeholders?
A single report document rarely serves every audience equally. The data that excites your operations team will bore your CFO, and the financial summary your board wants will mean nothing to a sponsor reviewing their lead ROI. Cvent’s guidance on visual reporting makes the point clearly: a well-organized, visual report with charts and summary tables enables faster decisions than a dense text document.
Tailoring by audience
Executives and board members want the one-page executive summary, a single ROI figure, and the top recommendation. Lead with the headline number, then the story behind it. Keep visuals to two or three charts: attendance vs. goal, revenue vs. cost, and NPS trend if you have prior-year data.
Sponsors need their own packet. Show leads captured, estimated impressions, and a fulfillment checklist confirming every contracted deliverable was met. Include a comparison of their results against event averages where you can. This is the document that drives renewal conversations.
Operations and logistics teams live in the appendix. They want the session attendance logs, vendor performance notes, AV uptime records, and the staffing debrief. Give them the full detail without filtering.
Marketing teams want channel performance, CPL by source, and conversion rates. Pair this with a recommendation on which channels to scale and which to cut for the next event.
Action-plan template for recommendations
Every recommendation in your report should carry four fields:
- Recommendation: What to change, specifically
- Owner: Named individual responsible
- Due date: Tied to the next event planning cycle
- Success metric: How you’ll know it worked
Pro Tip: Present the report in a live meeting, not just as an email attachment. A 30-minute debrief where you walk stakeholders through the top three findings and one recommendation per audience generates decisions. An emailed PDF generates replies asking for clarification two weeks later.
How do you turn event findings into a prioritized action plan?
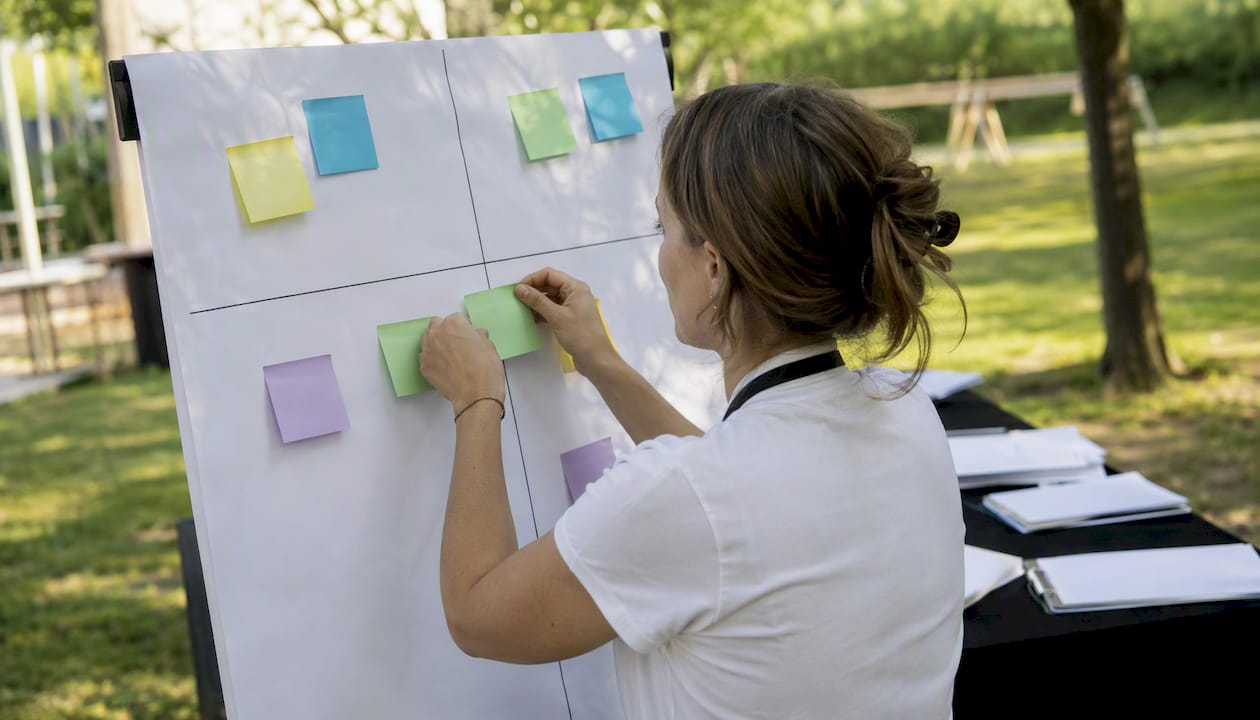
Post-event analysis transforms data into improvements only when findings are prioritized and assigned. The common failure is producing a lessons-learned list with 15 items and no clear starting point. A simple impact-vs.-effort matrix fixes that.
The prioritization matrix
Plot each recommendation on two axes: impact (high to low) and effort (low to high). Items in the high-impact, low-effort quadrant are your immediate priorities. High-impact, high-effort items go into the next planning cycle with a named owner. Low-impact items get deprioritized or dropped.
Assigning ownership:
- Name one person per recommendation, not a team
- Set a deadline tied to the next event’s planning kickoff
- Define the success metric before the next event, so you can measure it in the next PER
Using PER data in vendor and venue negotiations:
Accurate historical data from your PER is leverage. Documented room pick-up figures, attrition rates, and catering consumption numbers give you a factual basis for negotiating discounted rates, concession packages, and reduced attrition penalties. The APEX Post-Event Report explicitly recommends filing your PER with venues and attaching it to future RFPs precisely because it shifts the negotiation from opinion to evidence.
Recommended actions by priority level:
- Immediate (before next planning kickoff): Assign all high-impact, low-effort fixes; confirm vendor contracts reflect any negotiated changes
- Next planning cycle: Build high-impact, high-effort items into the event brief and budget
- Ongoing: Archive each PER in a shared folder accessible to your finance, marketing, and operations leads
Pro Tip: When renegotiating a venue contract, surface your documented room pick-up rate and actual F&B spend from the PER. Without the data, you’re negotiating on goodwill.
What King Sixteen measures for experiential activations
Standard conference metrics don’t fully capture what happens at a brand activation. When King Sixteen produces experiential campaigns for clients like Porsche, Ray-Ban, or Churchill Downs, the reporting framework extends beyond registrations and NPS to capture the metrics that actually reflect activation performance.
Experiential-specific metrics we track:
- Dwell time: Average time a guest spent engaged with the activation, measured via on-site observation or sensor data. Longer dwell time correlates with higher brand recall.
- Sampled conversion rate: Of guests who received a product sample or demo, what percentage completed a desired next action (scan, sign-up, purchase)?
- On-site lead capture quality: Not just volume, but completeness. A lead with name, email, phone, and purchase intent score is worth more than five badge scans with no follow-up data.
- AV and production uptime: Percentage of scheduled activation time where all AV, lighting, and interactive elements were fully operational. Downtime is a direct hit to impression volume.
- Social amplification rate: Organic posts, stories, and tags generated by attendees, measured against total attendance.
For brand activations, the report structure shifts slightly. The executive summary leads with brand impression volume and sampled conversion rate rather than ticket revenue. The financial section focuses on cost per impression and cost per qualified interaction rather than ticket-based ROI.
For private events, the report typically omits the sponsor packet and replaces the marketing performance section with a guest experience summary, covering arrival flow, entertainment timing, catering ratings, and any VIP-specific feedback.
Pro Tip: Build your attendee engagement metrics into the activation design, not the debrief. If you want dwell time data, plan for it: station staff with counters, use RFID wristbands, or design the activation flow so engagement is measurable by construction.
Who should own the report, and when should it be delivered?
The report should be owned by the primary event organizer or, for larger productions, the project management lead. Ownership means accountability for collecting data from every department, not writing every section personally.
Recommended delivery timeline:
- Within 48 hours: Distribute the one-page BLUF to all stakeholders. This preserves momentum and signals organizational discipline. Industry guides consistently recommend this cadence as the standard for maintaining stakeholder attention.
- Within 7 days: Deliver the full report, including all core sections through lessons learned. For large, multi-day conferences, extend to 14 days maximum.
- Within 30 days: Finalize the appendix with closed-deal attribution, final budget reconciliation, and all vendor invoices. Assign action-plan owners and confirm deadlines.
Roles and handoff checkpoints:
- Finance lead: Provides final actuals and budget variance within 5 business days post-event
- Marketing lead: Delivers channel performance and CPL data within 7 days
- Operations lead: Submits logistics notes and vendor performance scores within 48 hours
- Sponsor manager: Collects sponsor satisfaction surveys and lead counts within 72 hours
Schedule the internal debrief meeting within 5 business days. Waiting longer allows recollections to fade and reduces the quality of qualitative input. The debrief is where you surface the operational notes that never make it into a spreadsheet: the caterer who showed up 45 minutes late, the session that overran and cascaded into the afternoon schedule, the sponsor activation that drew three times the expected foot traffic.
King Sixteen handles the reporting so you can focus on what’s next
Most event teams spend the week after an event chasing data from five different vendors, reconciling spreadsheets, and trying to reconstruct what happened from memory. That’s not a reporting problem. It’s a production problem.
King Sixteen’s turnkey model builds data capture into the event itself. We set up lead scanning, track AV uptime, coordinate vendor handoffs, and deliver a structured post-event report framework before the event goes live, so your team isn’t starting from scratch on day one after. For brands that need a stakeholder-ready experiential marketing debrief, sponsor packet, and action plan, we handle the full reporting cycle alongside production. No chasing vendors. No reformatting spreadsheets. Just a clean, credible report your leadership can act on. Contact King Sixteen to discuss your next event and what a complete reporting package looks like for your brand.
Sources
These are the vetted references worth bookmarking for your next event debrief:
- How to Create a Post-Event Report That Proves ROI | Cvent Blog
- Event Report Template
- The Complete Guide For Making A Post Event Report + Free Template (Whova)
Every template above is a starting point, not a finish line. Adapt the structure to your event type: a brand activation report looks different from a multi-day conference PER, and a private event debrief differs from a trade show wrap-up. The discipline of using any consistent template, applied every time, is what builds the historical archive that makes every future event easier to plan, fund, and negotiate.