A guest journey map is a visual record of every stage and touchpoint a hotel guest crosses, from the first Google search to the post-stay review. It is the practical tool that turns a vague sense of “we need to improve the experience” into a ranked list of operational fixes tied to real revenue metrics like RevPAR and direct booking rate.
Start here, this week:
- Pick one persona. Choose your highest-volume or highest-failure-rate segment (business traveler, leisure couple, group attendee) and map that journey first. One focused map beats a sprawling one that covers everyone and fixes nothing.
- Assemble a cross-functional group. Bring one person from reservations, front desk, housekeeping, F&B, and marketing into a single room. The map only works when every department that touches the guest is in the conversation.
- Run a one-afternoon workshop. Block three to four hours, put the eight stages on a wall, and have each person add touchpoints, systems, and pain points they own. You will leave with a current-state map and a short list of fixes to prioritize.
Fixing key touchpoints through journey mapping can drive measurable gains in direct bookings and guest satisfaction scores. The longer your team operates on an implicit, undocumented mental model of the guest experience, the longer those gaps compound into lost revenue and negative reviews.
Key Takeaways
Guest journey mapping turns an implicit, departmentally siloed understanding of the guest experience into a ranked, owner-assigned action plan tied to measurable revenue and satisfaction KPIs.
| Point | Details |
|---|---|
| Start with one persona | Pick your highest-volume or highest-failure-rate segment and map that journey before expanding scope. |
| Run a cross-functional workshop | One person from each department, one afternoon, evidence required — produces a current-state map and a scored fix list. |
| Score friction by impact × frequency | Multiply both scores (1–5 scale) and fix touchpoints scoring 15 or above first. |
| Pre-arrival and post-stay are highest leverage | Automation in these two stages delivers fast ROI because manual processes are inconsistent and easy to replace. |
| Assign a named owner to every fix | A moment of truth without an owner is a risk nobody is managing — ownership is what converts the map into operational change. |
Table of Contents
- What are the eight hotel guest journey stages and their key KPIs?
- How to create a guest journey map in seven steps
- Which systems and data should you track at each touchpoint?
- How do you find moments of truth and score friction?
- How to run a one-afternoon guest journey mapping workshop
- A reusable guest journey map template and a filled example
- How to prioritize fixes and build a 30/60/90-day execution plan
- What experiential design teaches hotel teams about reliable moments
- Ready to turn your map into a live experience?
- The map is not the point — the fix list is
- Sources
What are the eight hotel guest journey stages and their key KPIs?
Every hotel guest moves through a predictable arc. The stages below represent the canonical hotel customer journey, from first awareness to post-stay loyalty. For each stage, the touchpoints listed are the most common points of contact, and the KPI is the single most useful signal to watch.
1. Research and inspiration
- Touchpoints: Google search, OTA listings, Instagram/TikTok, travel blogs, word-of-mouth referrals
- KPI: Share of branded search vs. generic search (tracks awareness growth)
2. Planning and decision
- Touchpoints: Hotel website, OTA comparison pages, review sites (TripAdvisor, Google), email from a past stay
- KPI: Website session-to-booking-page conversion rate
3. Booking
- Touchpoints: Booking engine (direct), OTA checkout, phone reservation, group RFP form
- KPI: Booking conversion rate and direct vs. OTA booking ratio
4. Pre-arrival
- Touchpoints: Booking confirmation email, pre-arrival messaging (SMS or email), upsell offers, digital check-in prompt
- KPI: Pre-arrival upsell attachment rate and digital check-in adoption rate
Pre-arrival is one of the most commonly neglected stages. Journey maps consistently reveal that pre-arrival and post-stay are the stages where automation delivers the highest leverage because manual processes are inconsistent across stays and easy to automate with a CRM or messaging platform.
5. Arrival and check-in
- Touchpoints: Curbside greeting, front desk interaction, mobile key activation, room orientation
- KPI: Check-in time (minutes) and first-impression NPS score
6. In-stay and occupancy
- Touchpoints: Housekeeping, F&B ordering, concierge requests, in-room technology, complaint handling
- KPI: Mid-stay NPS or in-stay service request resolution time
7. Departure and check-out
- Touchpoints: Express check-out, final bill review, luggage assistance, farewell interaction
- KPI: Check-out time and incidental dispute rate
8. Post-stay engagement and loyalty
- Touchpoints: Post-stay survey, review request email, loyalty program enrollment, re-engagement campaign
- KPI: Review response rate and repeat booking rate within 12 months
Pro Tip: Map the post-stay stage last but prioritize it early in your fix list. Most hotels invest heavily in arrival and in-stay while leaving post-stay on autopilot. A single well-timed review request email and a personalized re-engagement offer can move repeat booking rates faster than almost any in-stay upgrade.
How to create a guest journey map in seven steps
The seven-step mapping workflow below is designed to be workshop-ready. You can run it in a single afternoon with a cross-functional team.
Before the session, collect these data sources:
- Post-stay survey responses (last 90 days minimum)
- OTA and Google review text, sorted by recurring theme
- Booking funnel drop-off data from your booking engine
- PMS logs showing check-in times, room change requests, and complaint tickets
- Staff interviews (five to ten minutes each with front desk, housekeeping, and F&B leads)
- Any net promoter score data from mid-stay or post-stay touchpoints
Gathering this evidence before the workshop prevents the map from becoming an aspirational poster. Every claim on the map should be testable against at least one data source.
Step 1: Set the scope
Decide which guest segment, booking channel, and property you are mapping. A business traveler booking direct at a single urban property is a manageable scope. “All guests at all properties” is not. Narrow scope produces a usable map; broad scope produces a document nobody acts on.
Step 2: Define your persona
Build a one-page persona profile: demographics, booking behavior, primary goal for the stay, and the one thing most likely to make or break their experience. Creating a detailed buyer persona at this stage is what separates a map that drives decisions from one that describes everyone and helps no one.

Pro Tip: Pick your first persona using one of three criteria: highest revenue contribution (high-value), highest booking volume (high-volume), or highest complaint and cancellation rate (high-failure-rate). High-failure-rate personas often produce the fastest ROI because the fixes are usually operational, not capital-intensive.
Step 3: Map the stages
Write the eight stages across the top of a whiteboard or a shared digital canvas (Miro and Lucidchart both work well for remote teams). These become the columns of your map.
Step 4: List touchpoints per stage
Under each stage, have each team member add every touchpoint they own or observe. Include both digital touchpoints (confirmation emails, booking engine pages) and human ones (front desk greetings, concierge calls). Do not filter yet.
Step 5: Sketch best-case and worst-case flows
For each touchpoint, note what the experience looks like when everything works and what it looks like when it fails. This is where the map starts revealing operational gaps rather than just describing the ideal state.
Step 6: Log the systems
Next to each touchpoint, write the system that powers it: booking engine, PMS, CRM, messaging platform, or in-room tablet. This step is what connects the map to your tech stack and makes fixes executable. Different booking channels follow different journeys, so note whether the touchpoint behaves differently for direct bookings versus OTA arrivals.
Step 7: Identify moments of truth and assign owners
Circle the five to seven touchpoints where a failure would most damage the guest relationship or most directly cost a booking or a review. Assign a named owner to each one. A moment of truth without an owner is just a risk nobody is managing.
Which systems and data should you track at each touchpoint?
Translating touchpoints into tracked data is what turns a journey map into an operational audit. The table below maps the most common hotel touchpoints to their typical systems, the data worth capturing, and the metric to watch.
| Touchpoint | Typical System | Data to Capture | Suggested Metric |
|---|---|---|---|
| Hotel website | CMS, Google Analytics | Session source, exit pages, time on booking page | Session-to-booking-page conversion rate |
| Booking engine | Booking engine platform | Drop-off step, device type, promo code use | Booking conversion rate |
| OTA listing | OTA extranet | Review score, ranking position, rate parity flags | OTA review score vs. direct review score |
| Booking confirmation | PMS / CRM | Email open rate, upsell click-through | Upsell attachment rate |
| Pre-arrival messaging | CRM / messaging platform | SMS/email open rate, digital check-in completions | Digital check-in adoption rate |
| Check-in | PMS, mobile key app | Check-in duration, room change requests | Average check-in time (minutes) |
| In-room technology | In-room tablet / smart TV | Service request volume, F&B order rate | Service request resolution time |
| Housekeeping | PMS / task management | Room-ready time, complaint tickets | On-time room-ready rate |
| F&B ordering | POS / F&B platform | Average order value, order channel (app vs. phone) | F&B revenue per occupied room |
| Check-out | PMS | Express check-out adoption, dispute rate | Incidental dispute rate |
| Post-stay survey | Survey platform / CRM | NPS score, open-text themes | Net Promoter Score and review conversion rate |
Common integration failure points to check before your workshop:
- Booking engine to PMS: confirm that guest preferences and upsell selections transfer automatically, not via manual re-entry
- PMS to housekeeping system: verify that room-ready status updates in real time so front desk is not calling housekeeping for status checks
- CRM to messaging platform: check that pre-arrival sequences trigger correctly for both direct and OTA bookings, since OTA reservations often arrive without an email address
- Post-stay survey to reputation management tool: confirm that survey responses and review requests are not being sent to the same guest twice within 48 hours
Using event and guest data to personalize follow-ups is one of the highest-leverage moves available once your systems are connected. Before the workshop, run a quick audit: pull a sample reservation and trace it manually through each system to confirm the data actually exists and transfers correctly.
How do you find moments of truth and score friction?
A moment of truth is a touchpoint where the guest forms a lasting judgment about your hotel. Not every touchpoint qualifies. The ones that do tend to share two characteristics: they carry high emotional weight and they occur at a transition point in the stay.
Common hotel moments of truth:
- The booking confirmation email (first tangible proof the hotel is organized and attentive)
- The first ten minutes in the room (sets the entire in-stay expectation)
- The hotel’s response to a complaint (determines whether a dissatisfied guest becomes a loyal one or a one-star review)
- The final bill at check-out (a surprise charge here can undo an otherwise excellent stay)
Scoring friction: impact × frequency
Rate each touchpoint on two dimensions, each on a 1–5 scale:
- Impact: How severely does a failure at this touchpoint damage the guest relationship or cost a booking? (1 = minor inconvenience, 5 = booking cancellation or public negative review)
- Frequency: How often does a failure actually occur? (1 = rare, 5 = happens on most stays)
Multiply the two scores. Touchpoints scoring 15 or above are your priority fixes. A touchpoint that scores 5 on impact but only 1 on frequency (a catastrophic but rare failure) ranks lower than one scoring 4 on both (a serious problem that happens constantly).
Worked example: Pre-arrival messaging fails to send for OTA bookings because the CRM does not receive an email address from the OTA. Impact score: 3 (guest arrives without upsell offers or digital check-in instructions). Frequency score: 5 (happens on every OTA booking). Total score: 15. That is a priority fix.
Pro Tip: Mine your review text before scoring. Search for recurring phrases like “no one told me,” “I had to ask,” or “surprised by the charge.” These phrases map almost perfectly to high-frequency, high-impact failures. Using customer feedback to drive revenue starts with reading what guests are already telling you.
How to run a one-afternoon guest journey mapping workshop
A well-run workshop produces a current-state map, a scored list of friction points, and a short action plan with named owners. A cross-functional, evidence-first workshop format is what separates a map that drives change from one that gets filed away.
Who to invite and what they bring:
| Role | What They Bring | Decision Rights |
|---|---|---|
| Reservations / Revenue Manager | Booking funnel data, OTA performance, rate parity issues | Approve booking-stage fixes |
| Front Desk Manager | Check-in time data, complaint logs, room change patterns | Approve arrival/departure fixes |
| Housekeeping Supervisor | Room-ready times, service request patterns | Approve in-stay operational fixes |
| F&B Manager | Order data, upsell performance, complaint themes | Approve in-stay F&B fixes |
| Marketing Manager | Website analytics, email performance, review themes | Approve pre-arrival and post-stay fixes |
| Guest Experience Manager | NPS data, survey responses, VIP feedback | Facilitate and hold final prioritization vote |
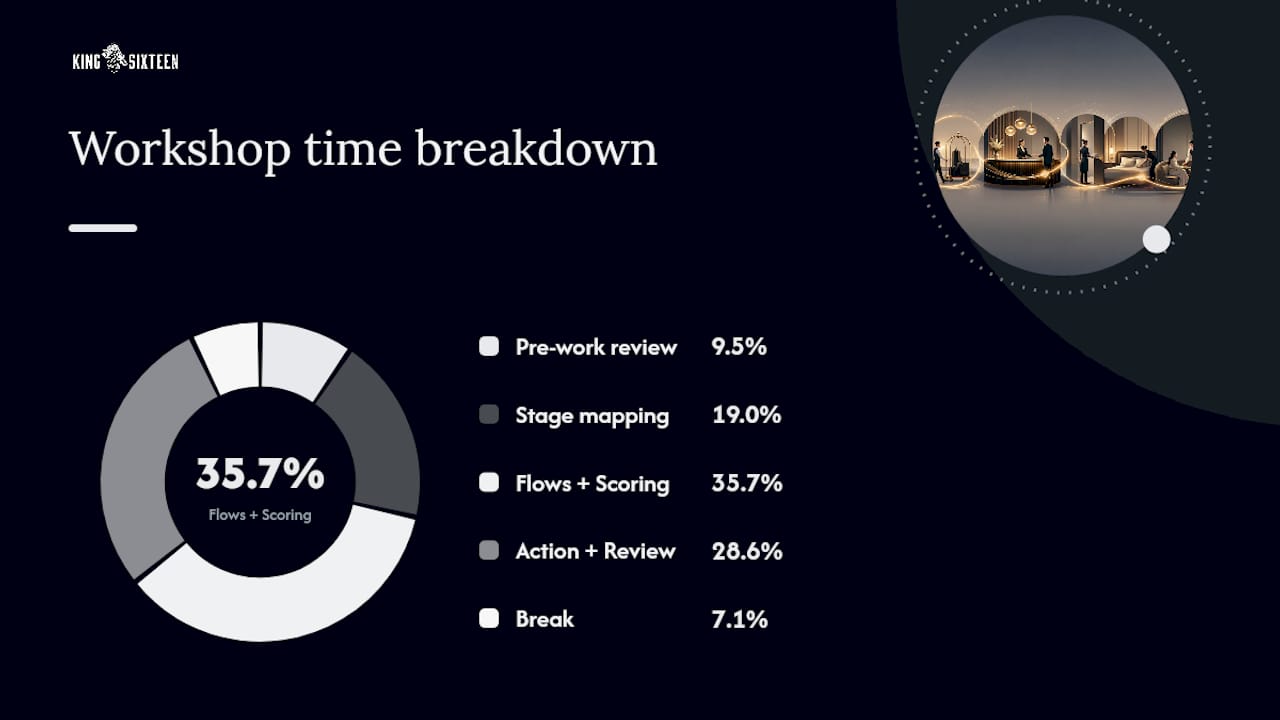
Timed workshop agenda (3.5 hours):
- 0:00–0:20 Pre-work review. Each attendee shares one data point they brought (a review theme, a funnel drop-off stat, a complaint ticket pattern). No data, no opinion.
- 0:20–1:00 Stage mapping. Work left to right through the eight stages. Each person adds touchpoints they own to the wall or canvas. No filtering yet.
- 1:00–1:45 Best/worst-case flows. For each touchpoint, note what works and what fails. Flag system gaps and handoff failures as you go.
- 1:45–2:00 Break.
- 2:00–2:30 Moments of truth scoring. As a group, score each flagged touchpoint on impact × frequency. Circle the top five.
- 2:30–3:00 Action sprint. For each top-five touchpoint, assign an owner, a fix hypothesis, and a 30-day deadline. Document on a shared sheet before anyone leaves the room.
- 3:00–3:30 Deliverables review. Confirm the map snapshot is saved, the scored fix list is shared, and the pilot plan has a named project lead.
Deliverables checklist before the room clears:
- Completed current-state map (photo or digital export)
- Scored friction list (top five touchpoints with impact × frequency scores)
- Named owner for each top-five fix
- 30-day pilot plan for the highest-scoring fix
- Agreed date for a 30-day check-in meeting
A reusable guest journey map template and a filled example
The template below gives you a consistent structure for any persona and any property type. Copy it into a spreadsheet or import it into Lucidchart or Miro as a table layer.
Generic template:
| Stage | Touchpoint | Guest Goal | Guest Emotion | System | Metric | Owner | Fix Hypothesis |
|---|---|---|---|---|---|---|---|
| [Stage name] | [Specific touchpoint] | [What the guest is trying to accomplish] | [How the guest feels here] | [System powering this touchpoint] | [KPI to track] | [Named team member] | [One-sentence fix to test] |
Filled mini-example: Business traveler booking direct (three stages)
| Stage | Touchpoint | Guest Goal | Guest Emotion | System | Metric | Owner | Fix Hypothesis |
|---|---|---|---|---|---|---|---|
| Booking | Direct booking engine | Complete reservation quickly, confirm rate and room type | Cautiously optimistic; watching for hidden fees | Booking engine platform | Booking conversion rate | Revenue Manager | Add a one-line rate guarantee message at checkout to reduce abandonment |
| Pre-arrival | Pre-arrival email (T-48 hours) | Confirm logistics, request early check-in, learn parking options | Organized but time-pressured | CRM / messaging platform | Email open rate; digital check-in adoption | Marketing Manager | Add parking and early check-in options as a single-click upsell in the email |
| Arrival | Front desk check-in | Get to the room fast; avoid a long queue | Tired; judging efficiency | PMS / mobile key app | Check-in time (minutes) | Front Desk Manager | Pilot mobile key activation for direct bookers to bypass the desk entirely |
For group and event-driven guest journeys, the event attendee experience guide offers a parallel framework worth adapting alongside this template.
How to prioritize fixes and build a 30/60/90-day execution plan
The map is only as useful as the action plan it generates. Use a two-axis prioritization framework to decide what to fix first.
Impact × effort matrix:
- High impact, low effort (fix first): Pre-arrival email sequence for OTA bookings, post-stay review request automation, mobile key activation for direct bookers
- High impact, high effort (plan carefully): PMS-to-CRM integration, full digital check-in rollout, loyalty program redesign
- Low impact, low effort (batch and delegate): Updating room directory content, refreshing email templates, adding parking info to confirmation emails
- Low impact, high effort (deprioritize): Custom in-room app development, full property Wi-Fi infrastructure upgrade
30/60/90-day milestone plan:
- 30 days: Fix the top-scoring friction point from the workshop. Assign one owner, define one success metric, and measure it daily. Typical quick wins include pre-arrival messaging gaps and booking confirmation clarity.
- 60 days: Implement two to three medium-effort fixes. Run a second NPS pulse survey to measure movement. Compare review themes from the 30-day window against the baseline you collected before the workshop.
- 90 days: Review the full map against current data. Update touchpoints that have changed, retire fixes that worked, and add new friction points surfaced by the 60-day data. Present a revised priority list to leadership with before/after KPI comparisons.
Cost and ROI signal estimates:
Linking these fixes to experiential ROI metrics from the start gives you the before/after data you need to justify the next round of investment to leadership.
What experiential design teaches hotel teams about reliable moments
The most memorable guest experiences are not the most elaborate ones. They are the ones that work every single time.
Consider a hotel that installs a dramatic arrival experience: a personalized welcome card, a signature scent in the lobby, and a staff member who greets the guest by name. When it works, it generates genuine loyalty. When the PMS fails to pass the guest’s name to the front desk, the staff member stumbles, the card is missing, and the guest notices the gap more sharply because the expectation was set high. The theatrical element amplified the failure.
Operational checklist for making experiential moments repeatable:
- Write a run sheet for every high-impact touchpoint, just as you would for a live event. Define who does what, when, and what the fallback is if the primary system fails.
- Staff the moment, not just the shift. Assign a named person to own each experiential touchpoint per shift, not just a department.
- Test the tech before every stay cycle. Mobile key activation, in-room tablet content, and pre-arrival messaging should be verified weekly, not assumed to be working.
- Build a contingency for every system dependency. If the PMS goes down, the front desk should have a printed guest list with names and room assignments ready.
- Debrief after failures. When a high-impact touchpoint fails, document it within 24 hours and update the run sheet before the next shift.
Pro Tip: Treat your top three moments of truth like a live event production. Write a cue sheet, assign a stage manager equivalent (a shift supervisor who owns the experience), and run a brief pre-shift check. The brand experience principles that make a product launch memorable apply directly to the moments that define a hotel stay.
Ready to turn your map into a live experience?

Guest journey mapping is the diagnostic. What you do with it is the strategy. At King Sixteen, we help brands translate exactly this kind of insight into immersive, operationally reliable experiences that guests remember and return for. Whether you are designing a high-impact arrival moment, producing a branded event on property, or building a guest experience program from the ground up, our turnkey model handles every detail.
See how King Sixteen builds brand experiences that move from map to memorable moment, or explore our private events services for event-driven guest journey work.
The map is not the point — the fix list is
Most hotel teams that attempt guest journey mapping stall at the same place: they produce a beautiful map and then struggle to act on it. The map becomes a slide in a presentation, not a working document. The conventional advice says “map the journey” as if the document itself creates change. It does not.
What actually drives improvement is the scored fix list, the named owner, and the 30-day deadline that come out of the workshop. The map is the diagnostic tool. The moment of truth scoring is the triage. The action sprint is the treatment. Hotels that see measurable gains from this process are the ones that treat the workshop as the beginning of an operational project, not the end of a strategy exercise.
The other thing most guides understate: the pre-arrival and post-stay stages are almost always the fastest path to measurable ROI. They are the stages most hotels have on autopilot, and they are the stages where a single automated sequence, a well-timed review request, or a personalized re-engagement email can move direct booking rates and NPS scores within 60 days. You do not need a full PMS overhaul to see results. You need to fix the two or three touchpoints where your guests are currently experiencing silence where they expected communication.
Start with the workshop. Score the friction. Fix the top three. Measure for 30 days. Then expand the map.
Sources
- Hotel Customer Journey Map: A Step by Step Guide to Understanding Guest Behavior
- Mapping the Hotel Guest Journey to Optimize the Customer Experience
- Mapping the Hotel Guest Journey
- Guest Journey Mapping: Transform Every Touchpoint Into Revenue